This quickstart gets the OEDI-SI web app running and executes a ready-made simulation template end-to-end. You will run the sample feeder scenario used throughout the Beginner track: an OpenDSS distribution feeder feeding a measurement federate and a state estimator, with the results captured by a recorder.
1. Get the code
git clone https://github.com/openEDI/oedisi-frontend-app.git
git clone https://github.com/openEDI/oedisi-components.git
cd oedisi-components && git submodule update --init --recursive && cd ..
2. Point the app at the components
The backend resolves components through the OEDISI_COMPONENTS environment variable,
which must point at the Components/ directory of oedisi-components:
export OEDISI_COMPONENTS="$(pwd)/oedisi-components/Components"3. Install and start
cd oedisi-frontend-app
npm install
uv --directory server sync
npm run dev:all
npm run dev:all starts three processes:
| Service | URL | Purpose |
|---|---|---|
| Frontend (Vite) | http:// | The web UI |
| Backend (FastAPI) | http:// | Builds and runs simulations |
| JupyterLab | http:// | Embedded result notebooks (full read-write access in local mode) |
4. Run a template
Open http://
localhost:5173 and go to Saved Templates.
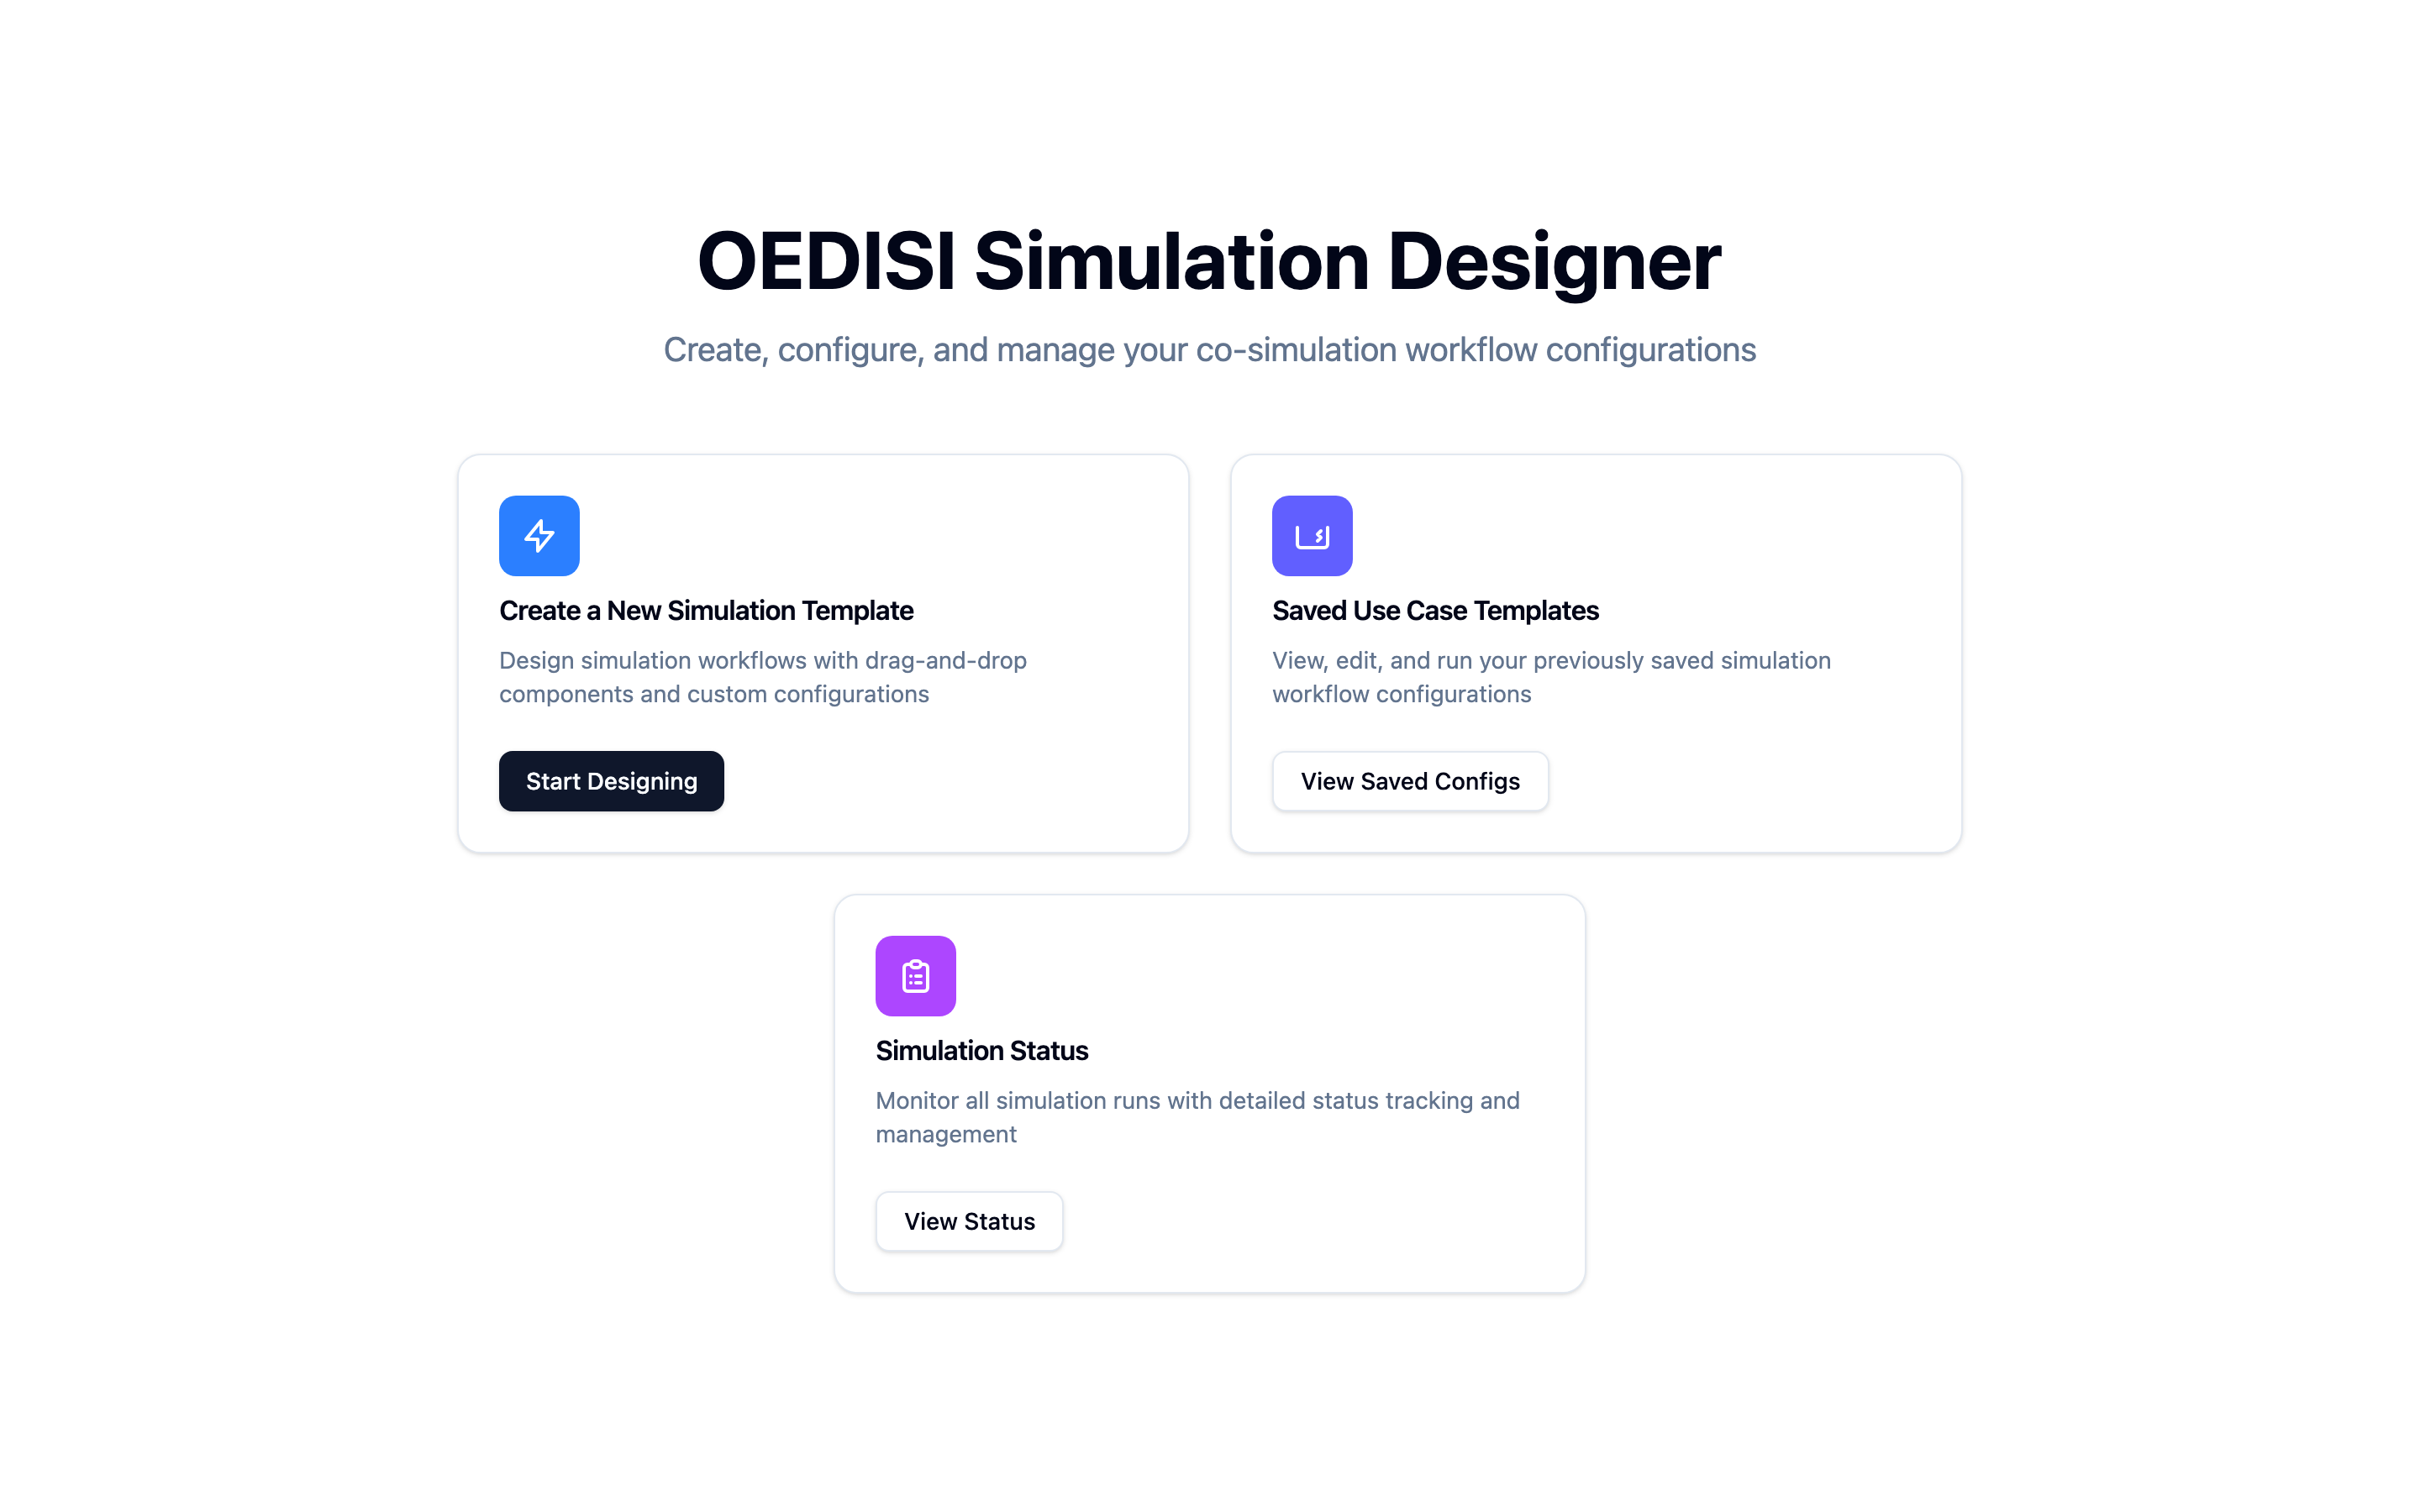
The OEDISI home page.
Pick a template and click Run.
You are taken to the run detail page — watch the status move from
runningtodoneand expand the per-federate logs.
5. See the results
When the run finishes, open Results to plot the recorded voltages over time, or open Notebook to analyze the raw data in JupyterLab.
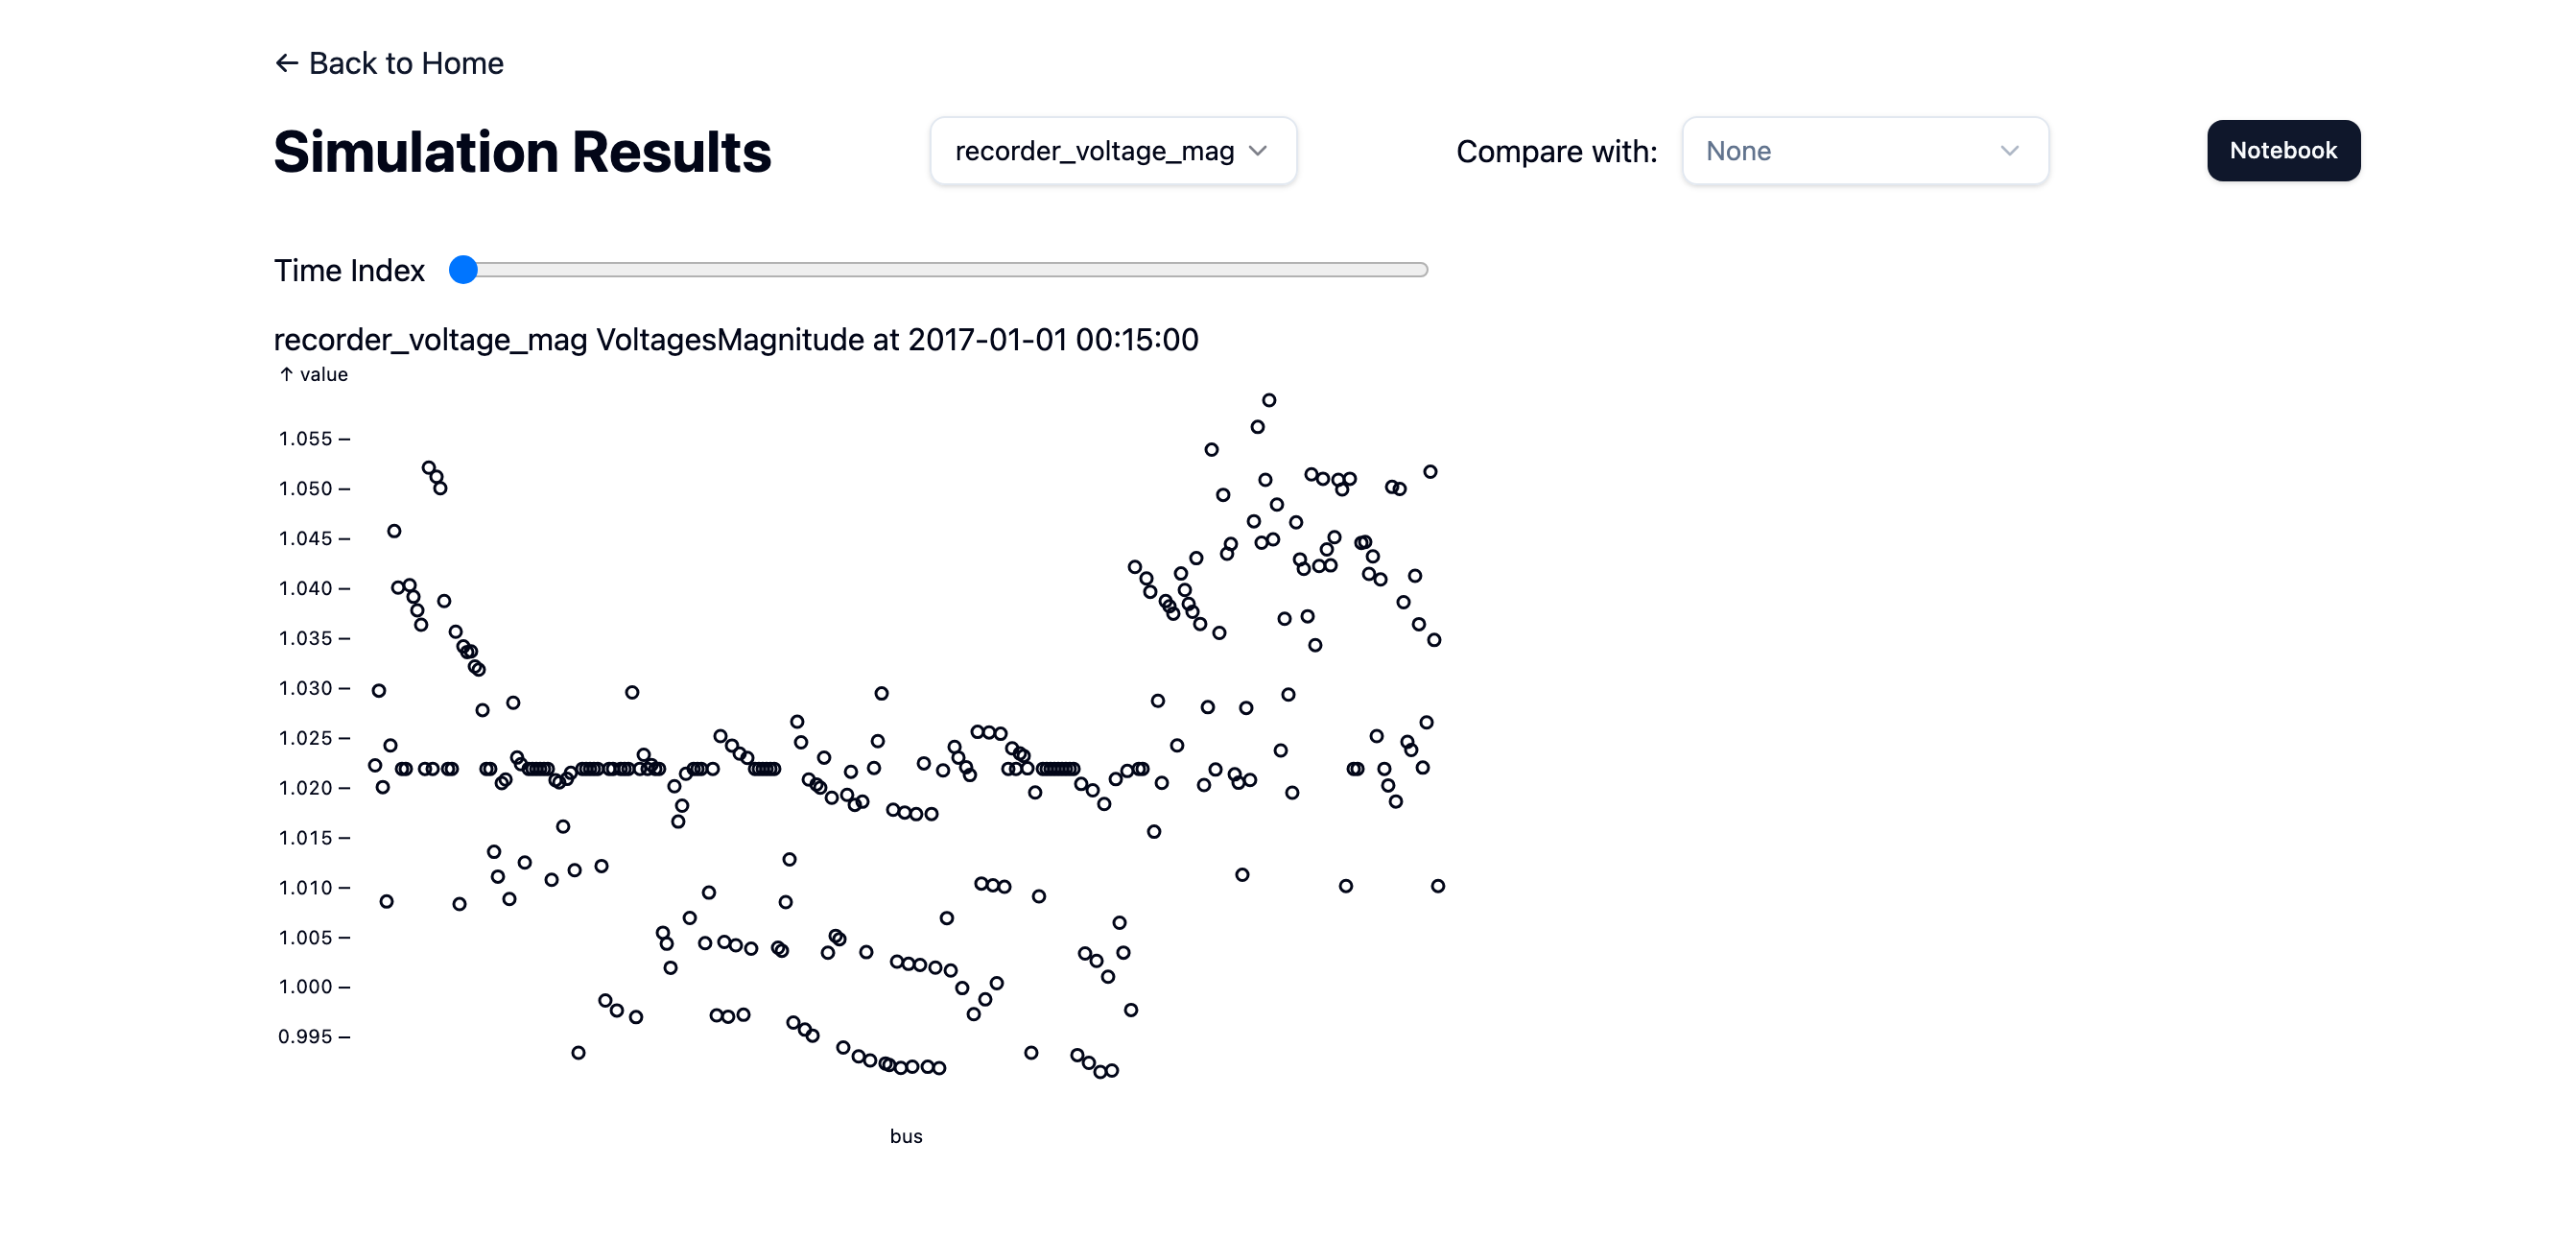
Recorded results, ready to explore.
Next steps
New to the UI? Take the guided tour.
Want to understand the moving parts first? Read How OEDI-SI works.
Ready to add your own algorithm? Go to Build a component.